

Best Data Visualization Tools Businesses Should Use in 2026

You must have heard the old saying ‘Let bygones be bygones’ It means that you should forget or shun mistakes you committed during the last few years. In 2026, you should do something different to give your business a new direction. That means you should use the best data visualization tools for your business that can transform complex data into intelligible visuals—dashboards, graphs and charts—that can let you take smarter and faster decision, expose hidden patterns, improve communication, boost productivity, and allow deeper operation analysis, bringing growth and competitive advantage.
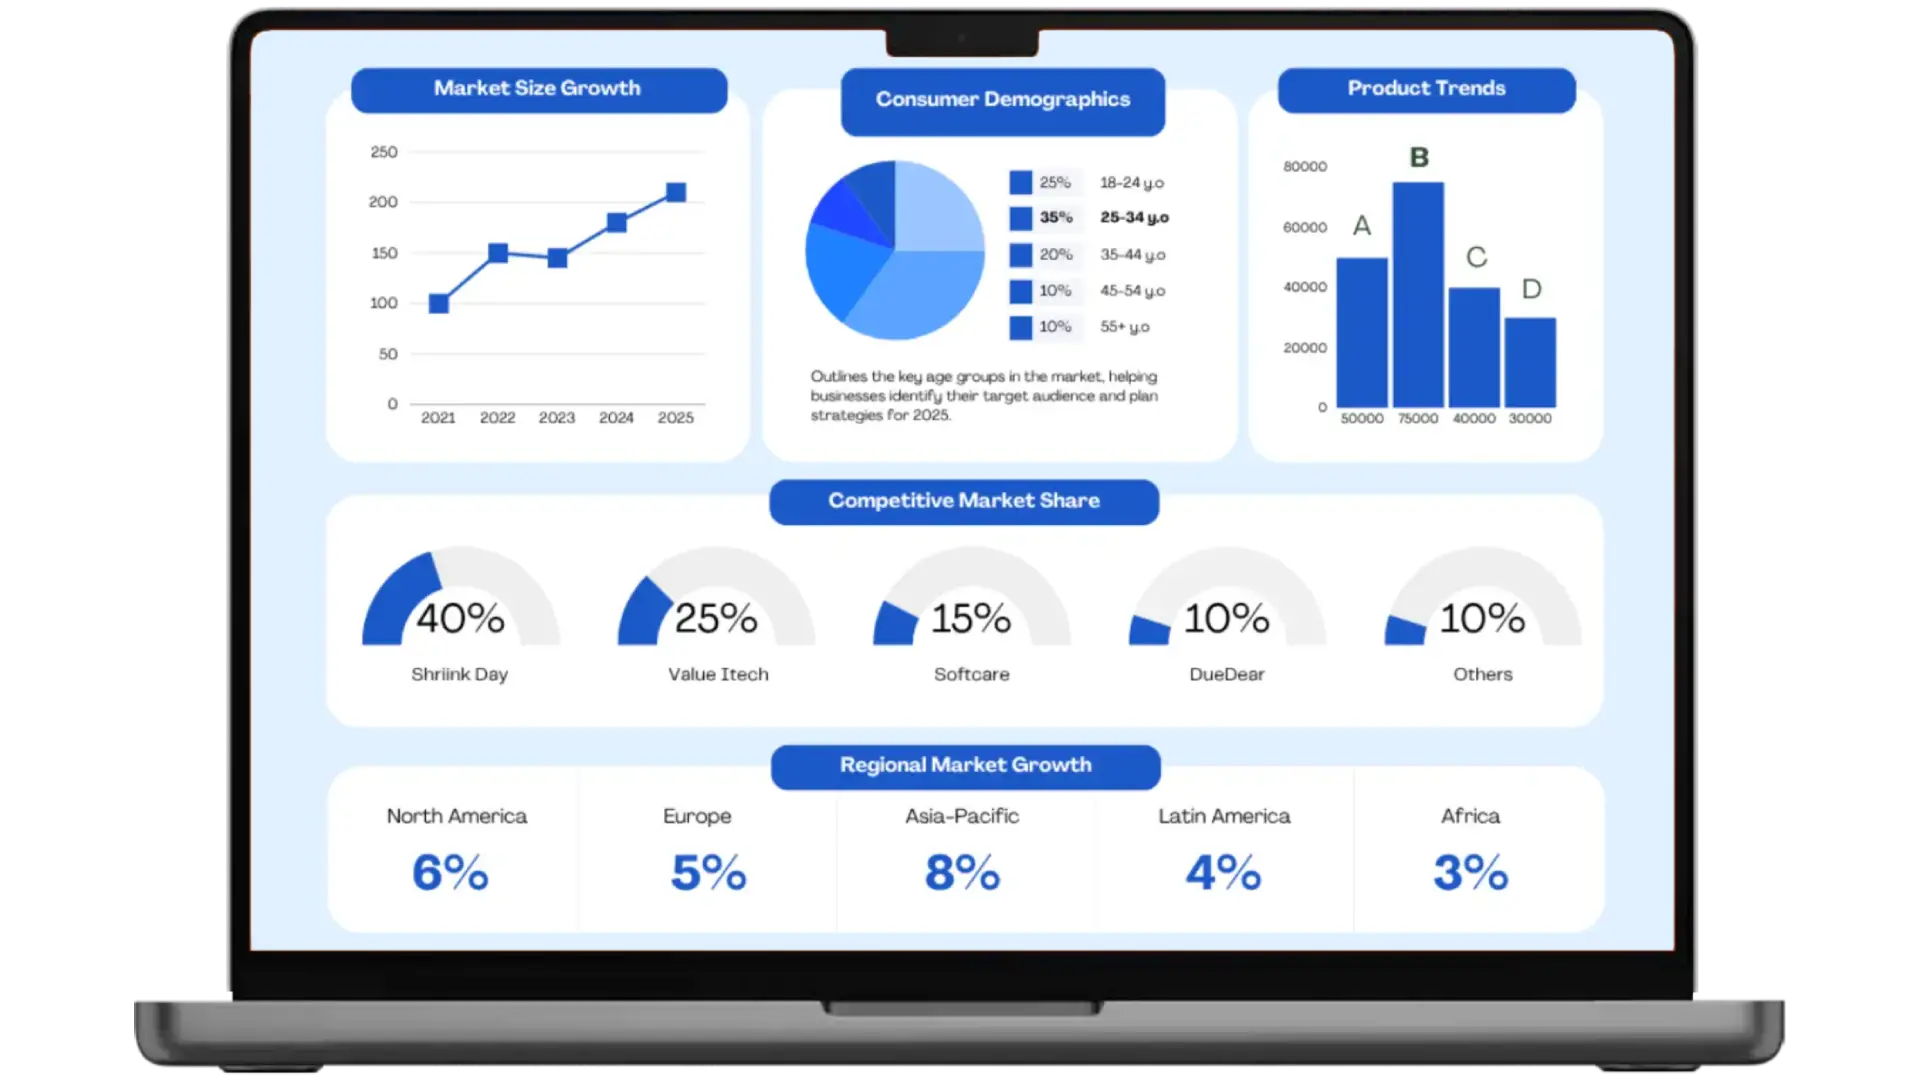
When it comes to modern data visualization software tools, they work beyond static charts. They allow various things—real time monitoring, interactive dashboards, predictive insights, and seamless integration with enterprise systems.
This blog sheds light on the best data visualization tools businesses should use in 2026, and how having partnership with a leading data visualization consulting company or data visualization service provider can maximize their value.
Why Does Data Visualization Hold More Importance Than Ever Before In 2026?
With prevalence of IoT, AI and cloud platforms, businesses are facing complex datasets. Data visualization helps you understand current trends, anomalies, and performance metrics. At present, organizations are using visualization for various purposes--real-time operational monitoring, customer behavior analysis, and financial performance tracking.
Where Does Data Visualization Find Its Place Between Business Intelligence And Business Analytics?
While choosing visualization tools, it is important for you to understand the difference between business intelligence and business analytics. The former lays focus on diagnostic and descriptive insights—what happened and what the reason was behind it. The latter goes deeper into prescriptive and predictive insights—what is likely to happen and what actions need to be taken. Modern BI visualization tools bridge both areas by blending historical reporting with advanced analytics, making them indispensable in the New Year.
Which Data Visualization Tools Should You Use In 2026?
Domo
It is a cloud-based platform, made for real-time business visibility. Its common use cases include retail and e-commerce analytics; tools such as Tableau and Power BI are extensively used as financial data visualization tools due to their flexibility and accuracy; risk and compliance reporting; cash flow analysis; and profit and loss dashboards.
Its best use cases include SaaS and digital businesses, cross-department reporting, real-time KPI monitoring, executive dashboards, and financial data visualization tools.
Its key applications include customer segmentation, inventory optimization, and sales performance analysis.
Qlik Sense
It is popular for its associative data model which enables you to explore data with complete freedom without predefined paths. Its key features include advanced data exploration, strong governance for enterprise use, self-service analytics, and AI-assisted insights.
Looker
With the movement of business to cloud-first strategies, it has grown considerably. Its key benefits include strong support for real-time data dashboards, centralized data modeling, and native integration with Google Cloud. It is perfect for those organizations that want to avail themselves of cloud-native enterprise BI visualization services.
Tableau
This tool continues to have its prevalence in storytelling and analytics. It is popular for enterprise-level analytics and financial data visualization tools. The benefits of choosing it include a strong community and ecosystem, excellent performance with large datasets, advanced analytics and AI-driven insights, and powerful drag-and-drop interface.
Microsoft Power BI
This is one of the most extensively used data visualization tools, as it has strong integration with Microsoft ecosystems. Its key strengths include strong support for power BI dashboard development, seamless integration with Excel and Azure, and interactive and scalable dashboards. It is cost-effective for enterprises. It is extensively used in executive reporting, operations, and finance, which makes it liver of modern data visualization software.
Which Industries Use Visualization And For What Purposes?
Infrastructure and construction use visualization for forecasting and cost tracking. Cloud estimating tools combined with visualization software help businesses identify budget risks early, make comparisons between estimates and actuals, and monitor project costs.
Difference Between Cloud-Based And On-Premises Visualization Tools
In 2026, many businesses will prefer cloud-based data visualization software for accessibility and scalability. Its benefits include seamless updates, remote access, faster deployment, and lower infrastructure costs. Nevertheless, some regulated industries make use of on-premises solutions with customized enterprise BI visualization services.
Why Should You Work With A Reliable Data Visualization Partner?
Although tools are powerful, their values depend on their implementation. A reliable data visualization service provider helps you combine multiple data sources, design intuitive dashboards, choose the right tools, and ensures governance and accuracy.
What Are The Key Trends In Data Visualization For 2026?
These trends include industry-specific visualization solutions, more focus on data governance and security, more use of real-time data dashboards, AI-driven insights and automated storytelling, and embedded analytics within business applications.
How To Choose The Right Data Visualization Tool For Your Business?
Consider the following tips:
- Need for real-time analytics
- Integration with existing systems
- Budget and scalability
- Industry requirements
- Data complexity and volume
Briefly Put!
In 2026, data visualization has become a necessity for your business. By using the right data visualization tools, you will be able to convert complex data into actionable insights, improve agility, and stay ahead of your competitors.
Related Article:
Data Visualization in Marketing Campaign Performance Tracking
What Are The Main Types of Data Analytics and How Do They Work?
How Does Data Analytics Beneficial for Business Growth?
Custodial vs Non-Custodial Crypto Wallet: Which Is Better for You?