Multi-Cloud Management Market Revenue Expected to Reach $40.35 Billion by 2029
Grab 20% Off With Code ONLINE20 On Global market Reports – Evaluate Global Trends, Market Risks, and Competitive Intelligence
How Has the Multi-Cloud Management Market Evolved in Terms of Size and Value From 2025 to 2029?
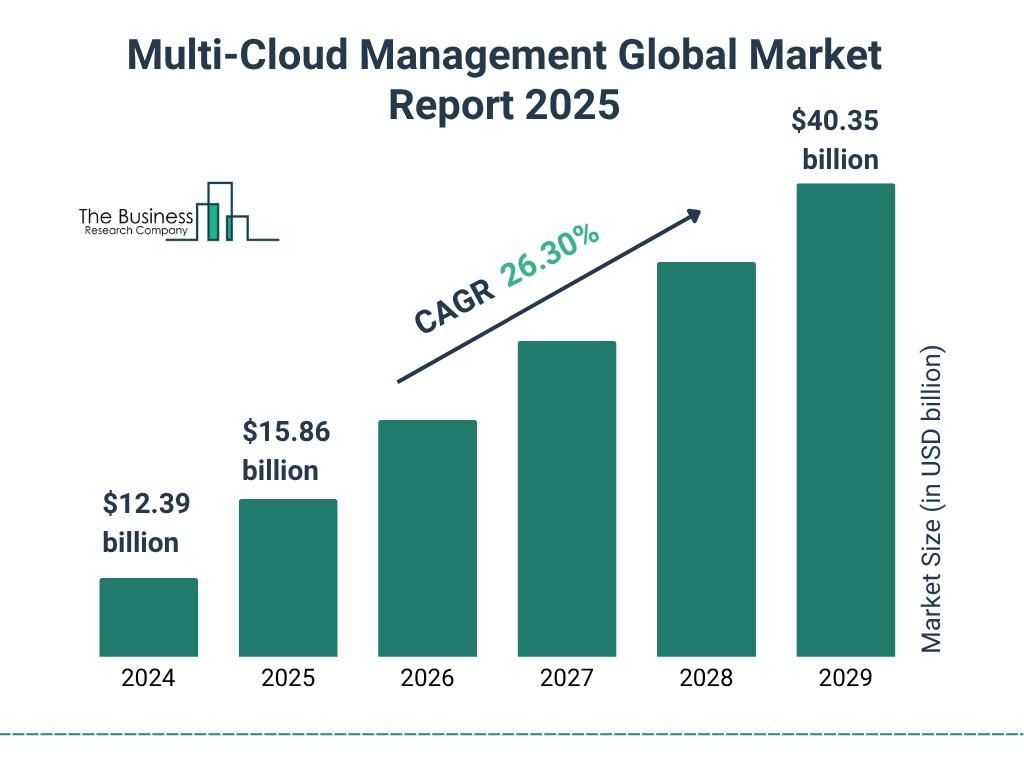
The multi-cloud management market size has grown exponentially in recent years. It will grow from $12.39 billion in 2024 to $15.86 billion in 2025 at a compound annual growth rate (CAGR) of 28.1%. The growth in the historic period can be attributed to growing cloud adoption, complexity of multi-cloud environments, security concerns, cost optimization needs, operational efficiency demands.
The multi-cloud management market size is expected to see exponential growth in the next few years. It will grow to $40.35 billion in 2029 at a compound annual growth rate (CAGR) of 26.3%. The growth in the forecast period can be attributed to advanced security requirements, focus on cost governance, increased complexity of multi-cloud environments, hybrid cloud expansion, regulatory compliance challenges. Major trends in the forecast period include rapid technological advancements, increased adoption of multi-cloud strategies, rising importance of interoperability, focus on cost optimization, automation for efficient management.
Get your free report sample today:
Multi-Cloud Management Market Size and Forecast Report 2025 Sample (https://www.thebusinessresearchcompany.com/sample.aspx?id=13492&type=smp)
Which Key Drivers Are Fueling Growth in the Multi-Cloud Management Market?
The increasing IoT-linked devices are expected to boost the growth of the multi-cloud management market going forward. IoT-linked devices are nonstandard computing devices that connect wirelessly to a network and transmit data. Multi-cloud management is helpful for IoT-linked devices as it allows for better management of the vast amounts of data generated by these devices across multiple cloud platforms, and it also will enable organizations to avoid being locked into a single cloud provider, which can limit their flexibility and increase costs. For instance, in November 2022, according to a report published by Ericsson, a Sweden-based telecommunication company, broadband IoT (4G/5G), which connects most cellular IoT devices, reached 1.3 billion connections in 2022. Nearly 60% of cellular IoT connections are anticipated to be broadband IoT connections by the end of 2028, with 4G connecting the bulk. Therefore, the increasing IoT IoT-linked devices is driving the growth of the multi-cloud management market.
What Are the Major Segments Defining the Structure of the Multi-Cloud Management Market?
The multi-cloud managementmarket covered in this report is segmented –
1) By Solution: Security And Risk Management, Training And Consulting, Reporting And Analytics, Cloud Automation, Managed Services, Other Solutions
2) By Deployment Model: Public Cloud, Hybrid Cloud, Private Cloud
3) By Enterprise Size: Small And Medium Enterprise, Large Enterprise
4) By End-Use: BFSI, IT And Telecom, Consumer Goods and Retail, Manufacturing, Healthcare, Media and Entertainment, Government, Other End-Uses
Subsegments:
1) By Security And Risk Management: Cloud Security Solutions, Identity And Access Management (IAM), Threat Detection And Mitigation, Compliance And Governance Tools
2) By Training And Consulting: Cloud Strategy Consulting, Cloud Migration Consulting, Multi-Cloud Architecture Training, Managed Service Provider (MSP) Consulting
3) By Reporting And Analytics: Cloud Performance Monitoring, Cost Management And Optimization, Cloud Usage Reporting, Business Intelligence And Analytics For Multi-Cloud
4) By Cloud Automation: Cloud Provisioning And Orchestration, Infrastructure As Code (Iac) Solutions, Cloud Service Automation Tools, Workflow Automation
5) By Managed Services: Cloud Operations Management, Multi-Cloud Monitoring And Support, Disaster Recovery And Backup Services, Service Level Agreement (SLA) Management
6) By Other Solutions: Multi-Cloud Data Management, Cloud Integration Tools, Multi-Cloud Networking Solutions, Cloud Cost Optimization
Which Disruptive Trends Are Reshaping the Competitive Landscape of the Multi-Cloud Management Market?
Major companies operating in the multi-cloud management market are developing innovative products, such as multi-hybrid cloud, to help enterprises with digital transformation. A multi-hybrid cloud is a computing environment that integrates and manages multiple hybrid cloud deployments. For instance, in April 2023, Cognizant, a US-based information technology company, launched a multi-hybrid cloud and edge management platform called Cognizant Skygrade. The platform is designed to help enterprises transition to modern cloud-native architectures and streamline their cloud management operations. The platform integrates and operates seamlessly across multi-cloud environments, addressing the full lifecycle of cloud transformation and fusing Cognizant’s AIOps, operations, and infrastructure modernization expertise into a comprehensive solution for digital transformation leaders.
Which Key Players Dominate the Multi-Cloud Management Market Landscape?
Major companies operating in the multi-cloud management market report are Microsoft Corporation, Dell Technologies Inc., Amazon Web Services Inc., International Business Machines Corp., Cisco Systems Inc., Oracle Corporation, Flexera Software LLC, Infosys Limited, Lumen Technologies Inc., VMware Inc., NetApp Inc., Citrix Systems Inc., Rackspace Technology Inc., CloudBolt Software Inc., BMC Software Inc., Snow Software AB, DivvyCloud Corporation, Trianz Holdings Pvt. Ltd., Virtana Corp., AppDirect Inc., Jamcracker Inc., Cloudenablers Inc., Stacklet Inc., RightScale Inc., CloudCheckr Inc., Turbonomic Inc., EnvZero Inc., Upbound, DoubleHorn LLC, Embotics Corporation
Get the detailed multi-cloud management market report today
Multi-Cloud Management Market Size and Forecast Report 2025 (https://www.thebusinessresearchcompany.com/report/multi-cloud-management-global-market-report)
Which Region Is Expected to Dominate the Multi-Cloud Management Market During the Forecast Period?
North America was the largest region in the multi-cloud management market in 2024. The regions covered in the multi-cloud management market report are Asia-Pacific, Western Europe, Eastern Europe, North America, South America, Middle East, Africa.
#Contact Us:#
The Business Research Company: Market Research Reports (https://thebusinessresearchcompany.com/)
Americas +1 310-496-7795
Asia +44 7882 955267 & +91 8897263534
Europe +44 7882 955267
Email: info@tbrc.info (mailto:info@tbrc.info)
#Follow Us On:#
LinkedIn: The Business Research Company | LinkedIn (https://in.linkedin.com/company/the-business-research-company)
Grab 20% Off With Code ONLINE20 On Global market Reports – Evaluate Global Trends, Market Risks, and Competitive Intelligence
How Has the Multi-Cloud Management Market Evolved in Terms of Size and Value From 2025 to 2029?
The multi-cloud management market size has grown exponentially in recent years. It will grow from $12.39 billion in 2024 to $15.86 billion in 2025 at a compound annual growth rate (CAGR) of 28.1%. The growth in the historic period can be attributed to growing cloud adoption, complexity of multi-cloud environments, security concerns, cost optimization needs, operational efficiency demands.
The multi-cloud management market size is expected to see exponential growth in the next few years. It will grow to $40.35 billion in 2029 at a compound annual growth rate (CAGR) of 26.3%. The growth in the forecast period can be attributed to advanced security requirements, focus on cost governance, increased complexity of multi-cloud environments, hybrid cloud expansion, regulatory compliance challenges. Major trends in the forecast period include rapid technological advancements, increased adoption of multi-cloud strategies, rising importance of interoperability, focus on cost optimization, automation for efficient management.
Get your free report sample today:
Multi-Cloud Management Market Size and Forecast Report 2025 Sample (https://www.thebusinessresearchcompany.com/sample.aspx?id=13492&type=smp)
Which Key Drivers Are Fueling Growth in the Multi-Cloud Management Market?
The increasing IoT-linked devices are expected to boost the growth of the multi-cloud management market going forward. IoT-linked devices are nonstandard computing devices that connect wirelessly to a network and transmit data. Multi-cloud management is helpful for IoT-linked devices as it allows for better management of the vast amounts of data generated by these devices across multiple cloud platforms, and it also will enable organizations to avoid being locked into a single cloud provider, which can limit their flexibility and increase costs. For instance, in November 2022, according to a report published by Ericsson, a Sweden-based telecommunication company, broadband IoT (4G/5G), which connects most cellular IoT devices, reached 1.3 billion connections in 2022. Nearly 60% of cellular IoT connections are anticipated to be broadband IoT connections by the end of 2028, with 4G connecting the bulk. Therefore, the increasing IoT IoT-linked devices is driving the growth of the multi-cloud management market.
What Are the Major Segments Defining the Structure of the Multi-Cloud Management Market?
The multi-cloud managementmarket covered in this report is segmented –
1) By Solution: Security And Risk Management, Training And Consulting, Reporting And Analytics, Cloud Automation, Managed Services, Other Solutions
2) By Deployment Model: Public Cloud, Hybrid Cloud, Private Cloud
3) By Enterprise Size: Small And Medium Enterprise, Large Enterprise
4) By End-Use: BFSI, IT And Telecom, Consumer Goods and Retail, Manufacturing, Healthcare, Media and Entertainment, Government, Other End-Uses
Subsegments:
1) By Security And Risk Management: Cloud Security Solutions, Identity And Access Management (IAM), Threat Detection And Mitigation, Compliance And Governance Tools
2) By Training And Consulting: Cloud Strategy Consulting, Cloud Migration Consulting, Multi-Cloud Architecture Training, Managed Service Provider (MSP) Consulting
3) By Reporting And Analytics: Cloud Performance Monitoring, Cost Management And Optimization, Cloud Usage Reporting, Business Intelligence And Analytics For Multi-Cloud
4) By Cloud Automation: Cloud Provisioning And Orchestration, Infrastructure As Code (Iac) Solutions, Cloud Service Automation Tools, Workflow Automation
5) By Managed Services: Cloud Operations Management, Multi-Cloud Monitoring And Support, Disaster Recovery And Backup Services, Service Level Agreement (SLA) Management
6) By Other Solutions: Multi-Cloud Data Management, Cloud Integration Tools, Multi-Cloud Networking Solutions, Cloud Cost Optimization
Which Disruptive Trends Are Reshaping the Competitive Landscape of the Multi-Cloud Management Market?
Major companies operating in the multi-cloud management market are developing innovative products, such as multi-hybrid cloud, to help enterprises with digital transformation. A multi-hybrid cloud is a computing environment that integrates and manages multiple hybrid cloud deployments. For instance, in April 2023, Cognizant, a US-based information technology company, launched a multi-hybrid cloud and edge management platform called Cognizant Skygrade. The platform is designed to help enterprises transition to modern cloud-native architectures and streamline their cloud management operations. The platform integrates and operates seamlessly across multi-cloud environments, addressing the full lifecycle of cloud transformation and fusing Cognizant’s AIOps, operations, and infrastructure modernization expertise into a comprehensive solution for digital transformation leaders.
Which Key Players Dominate the Multi-Cloud Management Market Landscape?
Major companies operating in the multi-cloud management market report are Microsoft Corporation, Dell Technologies Inc., Amazon Web Services Inc., International Business Machines Corp., Cisco Systems Inc., Oracle Corporation, Flexera Software LLC, Infosys Limited, Lumen Technologies Inc., VMware Inc., NetApp Inc., Citrix Systems Inc., Rackspace Technology Inc., CloudBolt Software Inc., BMC Software Inc., Snow Software AB, DivvyCloud Corporation, Trianz Holdings Pvt. Ltd., Virtana Corp., AppDirect Inc., Jamcracker Inc., Cloudenablers Inc., Stacklet Inc., RightScale Inc., CloudCheckr Inc., Turbonomic Inc., EnvZero Inc., Upbound, DoubleHorn LLC, Embotics Corporation
Get the detailed multi-cloud management market report today
Multi-Cloud Management Market Size and Forecast Report 2025 (https://www.thebusinessresearchcompany.com/report/multi-cloud-management-global-market-report)
Which Region Is Expected to Dominate the Multi-Cloud Management Market During the Forecast Period?
North America was the largest region in the multi-cloud management market in 2024. The regions covered in the multi-cloud management market report are Asia-Pacific, Western Europe, Eastern Europe, North America, South America, Middle East, Africa.
#Contact Us:#
The Business Research Company: Market Research Reports (https://thebusinessresearchcompany.com/)
Americas +1 310-496-7795
Asia +44 7882 955267 & +91 8897263534
Europe +44 7882 955267
Email: info@tbrc.info (mailto:info@tbrc.info)
#Follow Us On:#
LinkedIn: The Business Research Company | LinkedIn (https://in.linkedin.com/company/the-business-research-company)
Multi-Cloud Management Market Revenue Expected to Reach $40.35 Billion by 2029
Grab 20% Off With Code ONLINE20 On Global market Reports – Evaluate Global Trends, Market Risks, and Competitive Intelligence
How Has the Multi-Cloud Management Market Evolved in Terms of Size and Value From 2025 to 2029?
The multi-cloud management market size has grown exponentially in recent years. It will grow from $12.39 billion in 2024 to $15.86 billion in 2025 at a compound annual growth rate (CAGR) of 28.1%. The growth in the historic period can be attributed to growing cloud adoption, complexity of multi-cloud environments, security concerns, cost optimization needs, operational efficiency demands.
The multi-cloud management market size is expected to see exponential growth in the next few years. It will grow to $40.35 billion in 2029 at a compound annual growth rate (CAGR) of 26.3%. The growth in the forecast period can be attributed to advanced security requirements, focus on cost governance, increased complexity of multi-cloud environments, hybrid cloud expansion, regulatory compliance challenges. Major trends in the forecast period include rapid technological advancements, increased adoption of multi-cloud strategies, rising importance of interoperability, focus on cost optimization, automation for efficient management.
Get your free report sample today:
Multi-Cloud Management Market Size and Forecast Report 2025 Sample (https://www.thebusinessresearchcompany.com/sample.aspx?id=13492&type=smp)
Which Key Drivers Are Fueling Growth in the Multi-Cloud Management Market?
The increasing IoT-linked devices are expected to boost the growth of the multi-cloud management market going forward. IoT-linked devices are nonstandard computing devices that connect wirelessly to a network and transmit data. Multi-cloud management is helpful for IoT-linked devices as it allows for better management of the vast amounts of data generated by these devices across multiple cloud platforms, and it also will enable organizations to avoid being locked into a single cloud provider, which can limit their flexibility and increase costs. For instance, in November 2022, according to a report published by Ericsson, a Sweden-based telecommunication company, broadband IoT (4G/5G), which connects most cellular IoT devices, reached 1.3 billion connections in 2022. Nearly 60% of cellular IoT connections are anticipated to be broadband IoT connections by the end of 2028, with 4G connecting the bulk. Therefore, the increasing IoT IoT-linked devices is driving the growth of the multi-cloud management market.
What Are the Major Segments Defining the Structure of the Multi-Cloud Management Market?
The multi-cloud managementmarket covered in this report is segmented –
1) By Solution: Security And Risk Management, Training And Consulting, Reporting And Analytics, Cloud Automation, Managed Services, Other Solutions
2) By Deployment Model: Public Cloud, Hybrid Cloud, Private Cloud
3) By Enterprise Size: Small And Medium Enterprise, Large Enterprise
4) By End-Use: BFSI, IT And Telecom, Consumer Goods and Retail, Manufacturing, Healthcare, Media and Entertainment, Government, Other End-Uses
Subsegments:
1) By Security And Risk Management: Cloud Security Solutions, Identity And Access Management (IAM), Threat Detection And Mitigation, Compliance And Governance Tools
2) By Training And Consulting: Cloud Strategy Consulting, Cloud Migration Consulting, Multi-Cloud Architecture Training, Managed Service Provider (MSP) Consulting
3) By Reporting And Analytics: Cloud Performance Monitoring, Cost Management And Optimization, Cloud Usage Reporting, Business Intelligence And Analytics For Multi-Cloud
4) By Cloud Automation: Cloud Provisioning And Orchestration, Infrastructure As Code (Iac) Solutions, Cloud Service Automation Tools, Workflow Automation
5) By Managed Services: Cloud Operations Management, Multi-Cloud Monitoring And Support, Disaster Recovery And Backup Services, Service Level Agreement (SLA) Management
6) By Other Solutions: Multi-Cloud Data Management, Cloud Integration Tools, Multi-Cloud Networking Solutions, Cloud Cost Optimization
Which Disruptive Trends Are Reshaping the Competitive Landscape of the Multi-Cloud Management Market?
Major companies operating in the multi-cloud management market are developing innovative products, such as multi-hybrid cloud, to help enterprises with digital transformation. A multi-hybrid cloud is a computing environment that integrates and manages multiple hybrid cloud deployments. For instance, in April 2023, Cognizant, a US-based information technology company, launched a multi-hybrid cloud and edge management platform called Cognizant Skygrade. The platform is designed to help enterprises transition to modern cloud-native architectures and streamline their cloud management operations. The platform integrates and operates seamlessly across multi-cloud environments, addressing the full lifecycle of cloud transformation and fusing Cognizant’s AIOps, operations, and infrastructure modernization expertise into a comprehensive solution for digital transformation leaders.
Which Key Players Dominate the Multi-Cloud Management Market Landscape?
Major companies operating in the multi-cloud management market report are Microsoft Corporation, Dell Technologies Inc., Amazon Web Services Inc., International Business Machines Corp., Cisco Systems Inc., Oracle Corporation, Flexera Software LLC, Infosys Limited, Lumen Technologies Inc., VMware Inc., NetApp Inc., Citrix Systems Inc., Rackspace Technology Inc., CloudBolt Software Inc., BMC Software Inc., Snow Software AB, DivvyCloud Corporation, Trianz Holdings Pvt. Ltd., Virtana Corp., AppDirect Inc., Jamcracker Inc., Cloudenablers Inc., Stacklet Inc., RightScale Inc., CloudCheckr Inc., Turbonomic Inc., EnvZero Inc., Upbound, DoubleHorn LLC, Embotics Corporation
Get the detailed multi-cloud management market report today
Multi-Cloud Management Market Size and Forecast Report 2025 (https://www.thebusinessresearchcompany.com/report/multi-cloud-management-global-market-report)
Which Region Is Expected to Dominate the Multi-Cloud Management Market During the Forecast Period?
North America was the largest region in the multi-cloud management market in 2024. The regions covered in the multi-cloud management market report are Asia-Pacific, Western Europe, Eastern Europe, North America, South America, Middle East, Africa.
#Contact Us:#
The Business Research Company: Market Research Reports (https://thebusinessresearchcompany.com/)
Americas +1 310-496-7795
Asia +44 7882 955267 & +91 8897263534
Europe +44 7882 955267
Email: info@tbrc.info (mailto:info@tbrc.info)
#Follow Us On:#
LinkedIn: The Business Research Company | LinkedIn (https://in.linkedin.com/company/the-business-research-company)
0 Comments
0 Shares
470 Views